Emotional Footprint Awards 2019
Big Data
SoftwareReviews names IBM InfoSphere as Big Data Emotional Footprint Award Winners.
View Category
Big Data
Emotional Footprint Awards
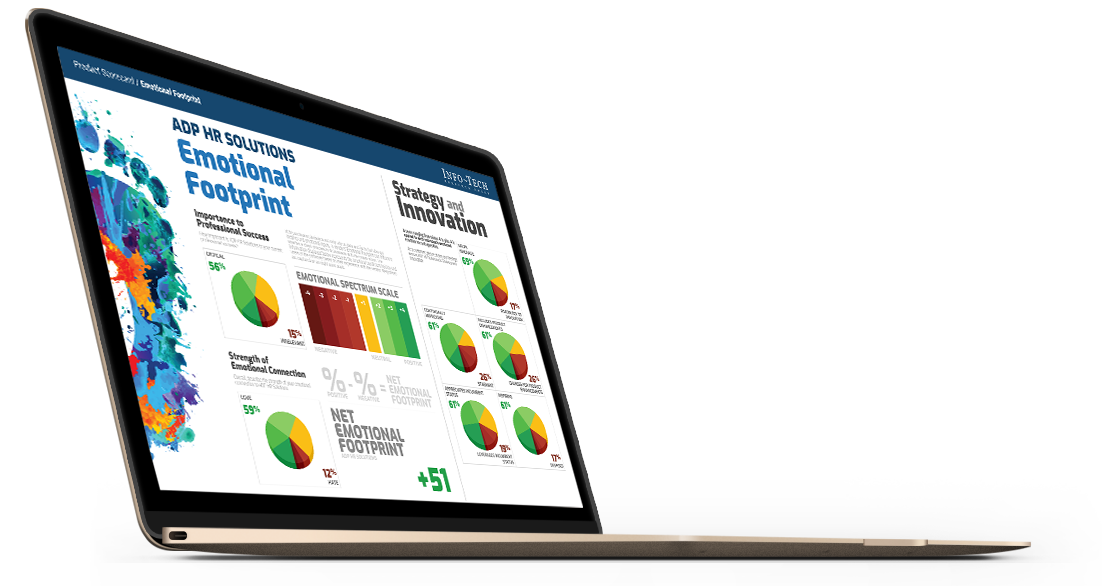
SoftwareReviews Emotional Footprint Awards evaluate and rank products based on emotional response ratings from IT and business professionals. Using our Emotional Footprint methodology, we aggregate emotional footprint scores across 26 dimensions of the vendor-client relationship and product effectiveness, creating a powerful indicator of overall user feeling toward the vendor and product.
Emotional Footprint Awards are proudly founded in 100% user review data and are free of traditional “magical” components such as market presence and analyst opinion, which are opaque in nature and may be influenced by vendor pressure, financial or otherwise.
Read The In-Depth Report
See how each vendor stacks up across each of the 26 dimensions and our thorough evaluation of vendor capabilities, product features, and overall satisfaction.
30+ pages

Measuring Emotional Footprint
Emotional Footprint is scored using our “Net Emotional Footprint” Index. This index tracks responses across 26 dimensions of emotional footprint that span 5 categories: Purchasing, Service Experience, Product Impact, Vendor Strategy, and Conflict Resolution. Then, the following calculation is done across this index:
% of Positive Reviews - % of Negative Reviews
For clarity, the total percentage of positive, neutral, and negative ratings is shown for each vendor as well.
Emotional Footprint Leaders
IBM
IBM InfoSphere
Gain industry-leading database performance across multiple workloads while lowering administration, storage, development and server costs; Realize extreme speed with capabilities optimized for analytics workloads such as deep analytics, and benefit from workload-optimized systems that can be up and running in hours.
8.4
CX Score
CX
Score
+86
Net Emotional Footprint
Net Emotional
Footprint
81
Value Index
VALUE INDEX
Other Evaluated Vendors
Cloudera
Cloudera Big Data
Cloudera offers the highest performance and lowest cost platform for using data to drive better business outcomes. Powered by the world’s most popular Apache Hadoop distribution, Cloudera Enterprise lets you focus on results.
8.2
CX Score
CX
Score
+67
Net Emotional Footprint
Net Emotional
Footprint
95
Value Index
VALUE INDEX
Microsoft
Microsoft Azure Big Data
Data volumes are exploding—from traditional point-of-sale systems and e-commerce websites to new customer sentiment sources like Twitter and IoT sensors that stream data in real time using Apache Hadoop and Spark. By analyzing a diverse dataset from the start, you’ll make more informed decisions that are predictive and holistic rather than reactive and disconnected.
8.2
CX Score
CX
Score
+83
Net Emotional Footprint
Net Emotional
Footprint
82
Value Index
VALUE INDEX
Hortonworks
Hortonworks Data Platform
HDP is the industry's only true secure, enterprise-ready open source Apache™ Hadoop® distribution based on a centralized architecture (YARN). HDP addresses the complete needs of data-at-rest, powers real-time customer applications and delivers robust analytics that accelerate decision making and innovation.
8.1
CX Score
CX
Score
+81
Net Emotional Footprint
Net Emotional
Footprint
81
Value Index
VALUE INDEX
Amazon Web Services
Amazon Web Services Big Data
Amazon Web Services provides a broad range of services to help you build and deploy Big Data applications quickly and easily. AWS gives you fast access to flexible and low cost IT resources, so you can rapidly scale virtually any big data application including data warehousing, clickstream analytics, fraud detection, recommendation engines, event-driven ETL, serverless computing, and internet-of-things processing.
7.9
CX Score
CX
Score
+84
Net Emotional Footprint
Net Emotional
Footprint
74
Value Index
VALUE INDEX
For the full press release, click here. For the full list of vendors in this space, click here.
Get Instant Access<br>to this Report
Get Instant Access
to this Report
Unlock your first report with just a business email. Register to access our entire library.
© 2025 SoftwareReviews.com. All rights reserved.